The bar chart shows the petroleum production and consumption among 7 regions in in 2002. Write a report for a university lecturer describing the information shown below.
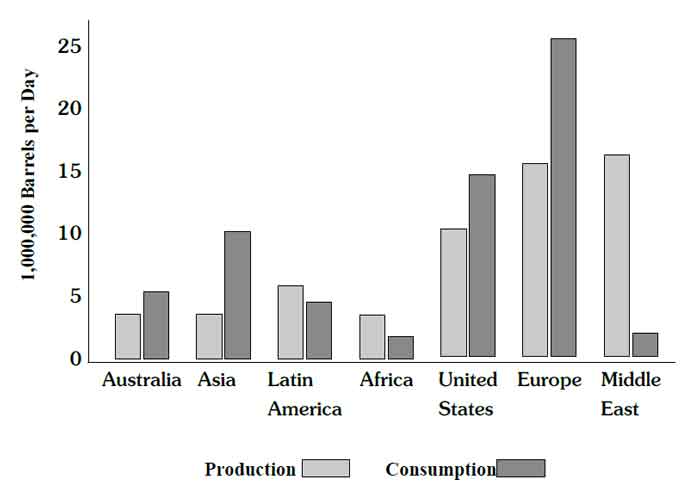
The column graph compares the tremendous difference among 7 regions in petroleum production and consumption in 2002.
Middle East was the highest one in production (around 17 million barrels per day)。 The petroleum production of Europe and the US ranked the second and the third respectively, while Australia and Asia produced the least among the seven regions, with no more than 5 million barrels per day.
However, in terms of consumption, Europe and US ranked the first and the second place respectively. The number of Asia(10) was much higher than that of Australia(5) and Latin America(4), and Africa and Middle East had the lowest number.
Four regions, Australia, Asia, the US, and Europe, consumed more petroleum than they produced. The other regions, Latin America, Africa, and the Middle East, produced more petroleum than they consumed. Among them,the production of Latin America was only slightly higher than its need. The petroleum production of Africa was twice as much as its consumption.
It is noticeable that Middle East had the highest production, but its consumption was the lowest.
柱状图对比了在2002年七个地区石油产量和消耗量的极大差别。我们还能看出中东的石油产量是多的(每天一千七百万桶)。欧洲和美国的石油产量分别位于第二和第三位,澳大利亚和亚洲则在七个地区中产量少,每天不超过五百万桶。然而,在消耗量上,欧洲和美国分别排在第一和第二位。亚洲的数字(10)比澳大利亚的(5)和拉丁美洲的(4)高很多。非洲和中东有着低的数字。
澳大利亚、亚洲、美国、以及欧洲这四个地区所消耗的石油数量比他们生产的数量大。其他地区-拉丁美洲、非洲、和中东-则生产了比其消耗量多的石油数量。在这三者之间,拉丁美洲的石油产量仅比它需要的数量略多。非洲的石油产量则是它消耗量的两倍。值得注意的是,中东有着高的产量,但是它的消耗量却是低的。
 勤学教育网合作机构>
>
广州雅思英语培训学校欢迎您!
勤学教育网合作机构>
>
广州雅思英语培训学校欢迎您!
